
Install pontiPy from TestPyPi Server through pip
In [1]:
# !pip install -i https://test.pypi.org/simple/ pontiPy==2.4
Import pontiPy
In [2]:
from pontiPy import *
Dependencies
In [3]:
import pandas as pd
import plotly.express as px
Confusion Matrix (1985-1986)
In [5]:
display(df)
Create a pontiPy Change Object
In [6]:
matrix_85_86 = pontiPy_Change(df)
Generate Change Matrix
In [7]:
matrix_85_86.matrix()
Out[7]:

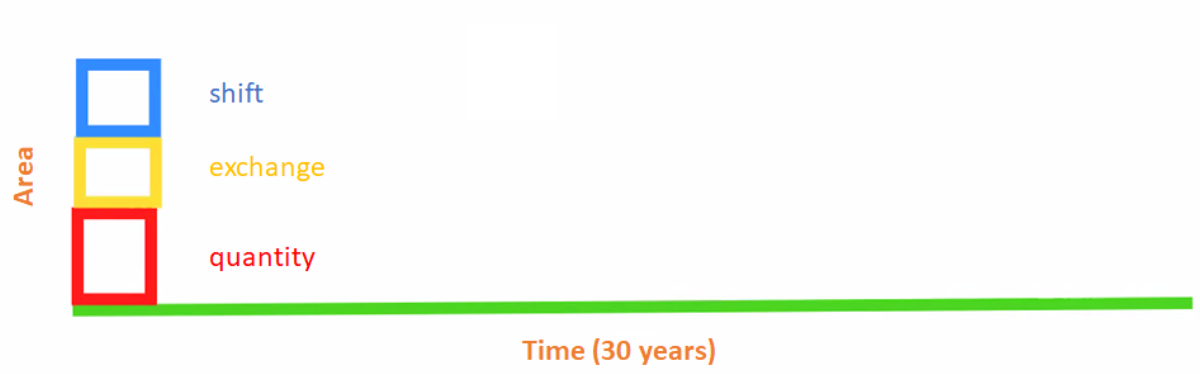
Quantity
In [8]:
matrix_85_86.quantity()
Out[8]:
Exchange
In [9]:
matrix_85_86.exchange()
Out[9]:
Shift
In [10]:
matrix_85_86.shift()
Out[10]:
Documentation